Blog #2 - Simple Graph Maker & Piktochart
Being an English for Academic Purposes instructor at Dalhousie, I often am required to include in my lessons statistical analysis, statistical data collection, statistical imaging, and finally statistical summarizing. If approached in the wrong way, such topics can really bore and frustrate students. Some common pitfalls include dealing with complex statistical imaging tools, attempting to graph data without the aid of tools, software incompatibility, complicated program sign-up applications, and getting mired in moot.
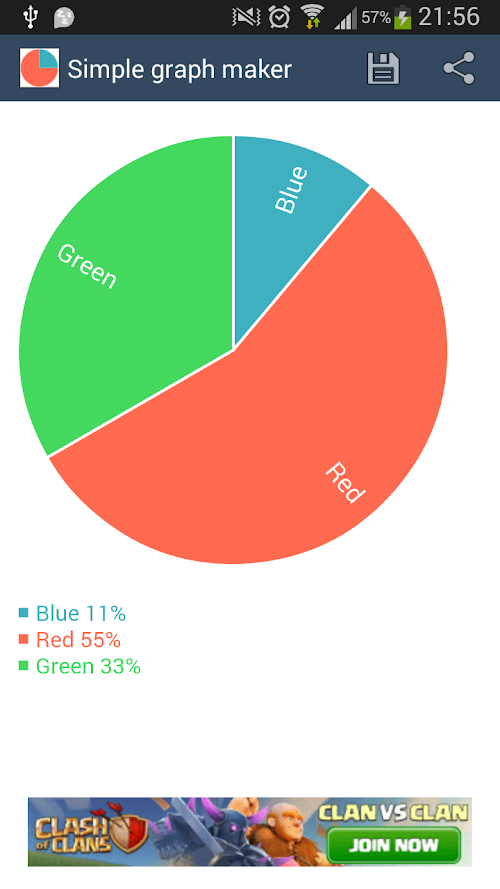
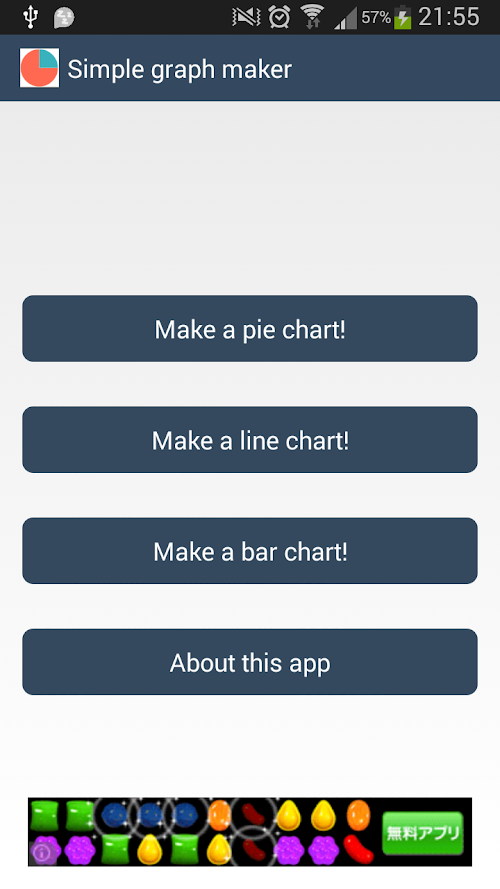
After trudging through app after app after app, I finally found a really simple graphing tool that students can learn how to use quickly and also one that students can produce and save images of to show the class on the smartboard. It is easy to sign-up, doesn't require any payment, is very user friendly, produces quick results, and doesn't try and corner you into any 'gold' programs. So in terms of quick set-up and easy-to-learn matters, I give it high marks.
Negative points include some students accidentally deleting their graphs, trouble entering decimal values, and a limited amount of design features/ options. How can these things be addressed though when the actual name of the app is 'simple'.
One great activity that works well and quick with these are in-class surveys. Each student in a 20 person class creates a survey question. Next, they mingle about and collect data for their particular query from each other. With the results in their notes, they map it into the app. Finally they present and summarize the results to the class by projecting the graph onto the board. This is a great way to manipulate statistical info from the bottom up. It also tends to motivate the students when they know that their results will go public. It's great seeing the class actually get excited about describing a pie chart!
This app is also a bit of a 'gate-way' drug to infographics. Once students learn the power a good statistical image can wield, and how easy it is to produce, they may get the bug to use more complex and interesting info-graphic imaging.
On particular program that I am just getting into and would like to learn more about is Piktochart. As our language becomes more and more emojified and colored with simple design tools, its only a matter of time before we can whip up a wonderful infographic in the place of a 500 word essay.
Piktochart
https://piktochart.com/formats/infographics/
Simple Graph Maker
https://play.google.com/store/apps/details?id=me.kirimin.graphmaker&hl=en_CA


Comments
Post a Comment